|
Video | What Is Data Storytelling? | Storytelling vs. Visualization | Key Principles | Replace or Support? | Misleading Charts | Presenting Data Ethically | Conclusion | Sources |
In this video, a data visualization instructor redesigns four real charts (Titanic survival rates, a McKinsey jobs slide, UFO sightings, and a crowded radial chart) and shows how a different chart type, a sharper title, and a few callouts turn the same data into a clear message.
What Is Data Storytelling?
Data storytelling is designing a chart and its words so the reader sees one specific conclusion.
A chart can hold all the right numbers and still leave the reader to work out what they mean. Data storytelling closes that gap. As this week’s video puts it, “your data is only as good as the story it tells.”
Research offers a similar definition. Shao et al. (CHI 2024) describe a data story as a visualization combined with narrative elements: explanatory titles, text annotations, annotated data points, and color emphasis, with clutter removed. Cole Nussbaumer Knaflic separates exploratory analysis, where an analyst looks for findings, from explanatory communication, where a writer hands a finding to a reader. Data storytelling is explanatory.
Where it is used. Segel and Heer (2010) study journalists who build visualizations into news articles, sometimes letting the visualization carry the story. Consultants use it on slides, such as McKinsey’s jobs-and-income slide. In this course, it is how you present data in a memo or report.
Data Storytelling vs. Data Visualization
Data visualization shows the data. Data storytelling directs the reader to a conclusion.
A visualization can be accurate and still leave the reader without a clear point. A chart of Titanic passengers by sex and class is an example. It can contain every group’s numbers, but if it uses stacked columns, the eye compares column heights and sees how many people were in each group. The survival percentage, which is the interesting question, is in the chart but not emphasized.
Storytelling works with the same data but adds decisions about it: which chart to use, what the title says, and what to emphasize. Shao et al. tested the difference with 103 participants. Readers who saw data stories answered more questions correctly than readers who saw conventional visualizations (median 0.889 vs. 0.667), and the benefit did not depend on how skilled they were at reading charts. The study’s authors caution that the benefit was not uniform across question types.
Key Principles of Data Storytelling
Five principles help turn a chart into a story: choose the chart that fits the message, title the takeaway, call out the key number, split crowded charts, and use color to point.
1. Choose the chart that makes the right comparison easy. Every chart type makes some comparisons easy and others hard. Bar and column charts invite the reader to compare individual bars. Line charts invite the reader to follow a shape. Stacked columns emphasize totals, and 100% stacked bars emphasize proportions. Pie and donut charts show one share of a whole. The choice starts with the message: decide which comparison the reader needs to make, then pick the chart that makes it easy.
| Method | Best At |
| Table | Precise values and comparisons across categories |
| Bar chart | Comparing categories; ranking |
| Line chart | Trends over time |
| Pie or donut chart | One share of a whole, with few slices |
| Stacked and 100% stacked | Totals within categories, or proportions within categories |
| Scatter plot | The relationship between two numerical variables |
| Combination chart | Two kinds of data in the same space |
| Diagram | Mechanisms, processes, and concepts |
| Photograph | Cases where realism matters |
The same data shows how much the choice matters. Take the Titanic passenger data. Stacked columns show how many people were in each group. A pie of everyone aboard shows the overall survival rate, 32%. Horizontal bars by class rank the groups, with first class surviving most. Splitting the bars by sex shows women surviving at higher rates in every class, and crew members doing better than third-class passengers within each sex. A 100% stacked bar with a column of group totals explains why: there were only 23 women in the crew, and 87% of them survived, while 862 men in the crew survived at 22%. Six charts built from one dataset tell six different stories, which is the video’s point: “It’s the same data, but a much different story.”
Trends and proportions work the same way. A column chart of yearly UFO sightings invites a message about a spike in particular years. A line chart of the same data invites a message about growth over two decades. Bars focus attention on individual periods, and lines on the shape of the whole. Likewise, a stacked column of jobs by income suits a message about where most jobs are, while a 100% stacked column suits a message about which income groups have the largest share of vulnerable jobs. In that case the segments of a stacked column are hard to compare, because the eye reads height, not percentage.
Textbooks add practical limits. Concordia’s open text says to use pie charts only for a few distinct slices, ordered largest to smallest, and to switch to a bar chart when the differences are small. Ohio State’s text limits pie charts to five or fewer categories with labeled percentages, recommends bar graphs when one variable is a category, and recommends scatter plots when both variables are numerical. Open Technical Communication says tables suit precise numbers, while charts sacrifice precision for impact. If the message changes, check whether the chart should change with it. Genre Focus: Choosing the Right Chart covers each method in detail.
2. Title the takeaway. A title can label a chart or state its conclusion. “Vulnerable Jobs by Income” labels it. “Lower-income jobs are disproportionately at risk” states the conclusion, and the reader knows what to believe before reading a single axis. One data visualization instructor puts the advice this way: “Tell the audience what you want them to believe after viewing that chart.” HACC’s open text makes the same recommendation for captions: make them interpretive, stating the main point in a complete sentence. Shao et al. include explanatory titles among the elements of a data story, and participants found annotations helpful for understanding insights. Subtitles can carry the supporting findings, one per chart.
3. Call out the key number. Most charts contain many numbers, and the reader has to find the one that matters. A callout does the finding for them: set the figure in large type, or annotate the point on the chart. Shao et al. list annotated data points among the elements of a data story. In a jobs chart that already showed that 74% of vulnerable jobs pay under $40,000, the redesign simply pulled out the number and placed it beside a donut chart, where three-quarters of a circle matches the figure.
4. Split crowded charts. A chart should carry one message. When a chart carries several, the reader has to separate them. A radial chart is a typical case: comparing categories means following the wheel around. Splitting it into several small charts facing the same direction, then turning them into horizontal bars, lets the reader rank the categories in a glance. Horizontal bars also leave room for long category labels, as Concordia’s text notes. Ohio State’s chapter warns that crowded graphics can confuse readers, and Tufte’s data-ink ratio is a well-known statement of a related idea: ink on a chart should carry data. Splitting one crowded chart into a series, each highlighting a different category, also lets you emphasize one thing at a time.
5. Use color to point. Color is a strong signal, so spend it on the part of the chart you want the reader to see first. A common approach is to highlight the category under discussion in a strong color and mute the rest in gray, so the chart keeps its context while the eye goes where the writer wants. Shao et al. found participants rated color emphasis helpful for spotting key data points. HACC’s open text adds two rules: use one color for a given meaning, and key any color coding. Howdy or Hello? warns that red-green and yellow-blue pairings fail for color-blind readers, and Concordia and Ohio State both require that graphics be readable in grayscale. Borland and Taylor (2007) explain why default rainbow color maps mislead readers.
Replace the Text or Support It?
The academic sources say visuals support text. The workplace says they replace it. This course takes both positions.
The academic position. Suzan Last (BCcampus) writes that “visuals clarify, illustrate, and augment your written text.” She adds that “a picture is worth a thousand words” “does not hold true in technical writing,” though “adding visuals may save you a hundred words or so of additional explanation and clarification.” Ohio State’s chapter says the text should carry the story, and Mindful Technical Writing says illustrations supplement written information.
The workplace position. A decision-maker with limited time will often read the table and skip the paragraphs. Scannability has been our theme for weeks, and Howdy or Hello? points the same way: you don’t need to repeat specific information from a graphic, only tell the reader what to look for. It even shows a draft revised by moving numbers out of paragraphs and into a table.
Course position. Replace the description, keep the interpretation. Delete the sentences that restate what the visual shows. Keep the sentences that introduce it and say what it means.
Misleading Charts in History
Misleading charts are not new, and they are not always intentional.
These cases show how a chart can mislead, and how hard it is for a reader to tell accident from intent.
Darrell Huff, How to Lie with Statistics (1954). Huff’s book is an early and widely cited catalogue of chart tricks. One is the pictogram: scale a picture in both height and width, and its area grows much faster than the number it represents. Wikipedia, citing Huff (p. 72), describes a house-sales pictogram that makes a doubling look like an eightfold increase.

Pictogram scaled in two dimensions. Source: Wikimedia Commons, via Wikipedia, “Misleading graph.”
Misleading pie charts. Pie charts can mislead too. In Wikipedia’s example of a misleading pie chart, item C looks at least as large as item A, though it is less than half its size.

A pie chart that misrepresents slice sizes. Source: Wikimedia Commons, via Wikipedia, “Misleading graph.”

The same data in a standard pie chart. Source: Wikimedia Commons, via Wikipedia, “Misleading graph.”
Georgia’s COVID-19 chart (2020). In May 2020, Georgia’s Department of Public Health posted a bar chart of the five counties with the most confirmed cases. It appeared to show cases falling every day for two weeks. According to GPB reporter Stephen Fowler, the dates on the x-axis were not in chronological order, and the counties changed position from day to day. Fowler wrote: “There was a bad graph. DPH was asked and it changed after a day.”
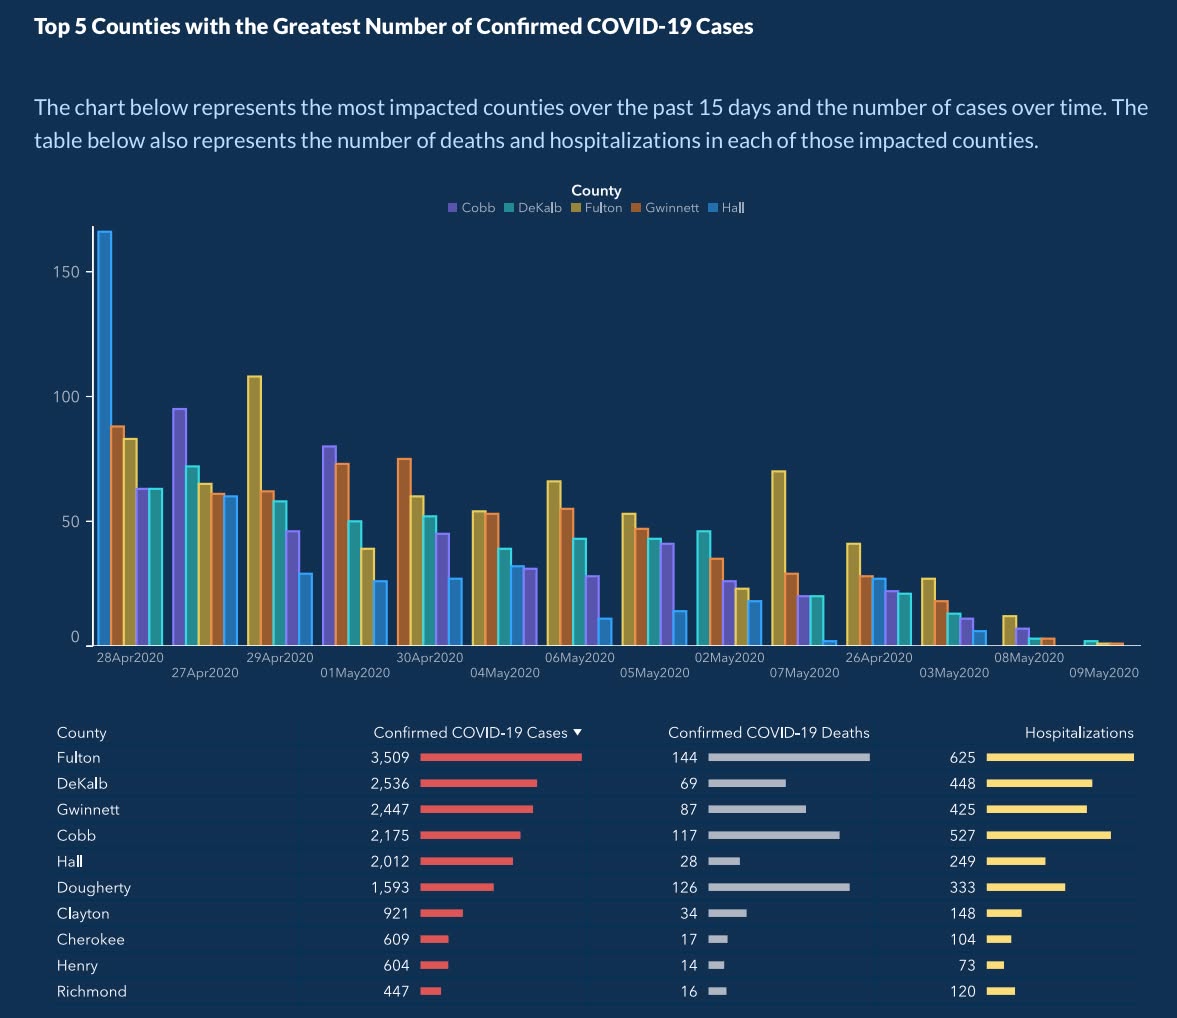
The chart as first posted. Credit: Georgia Department of Public Health.
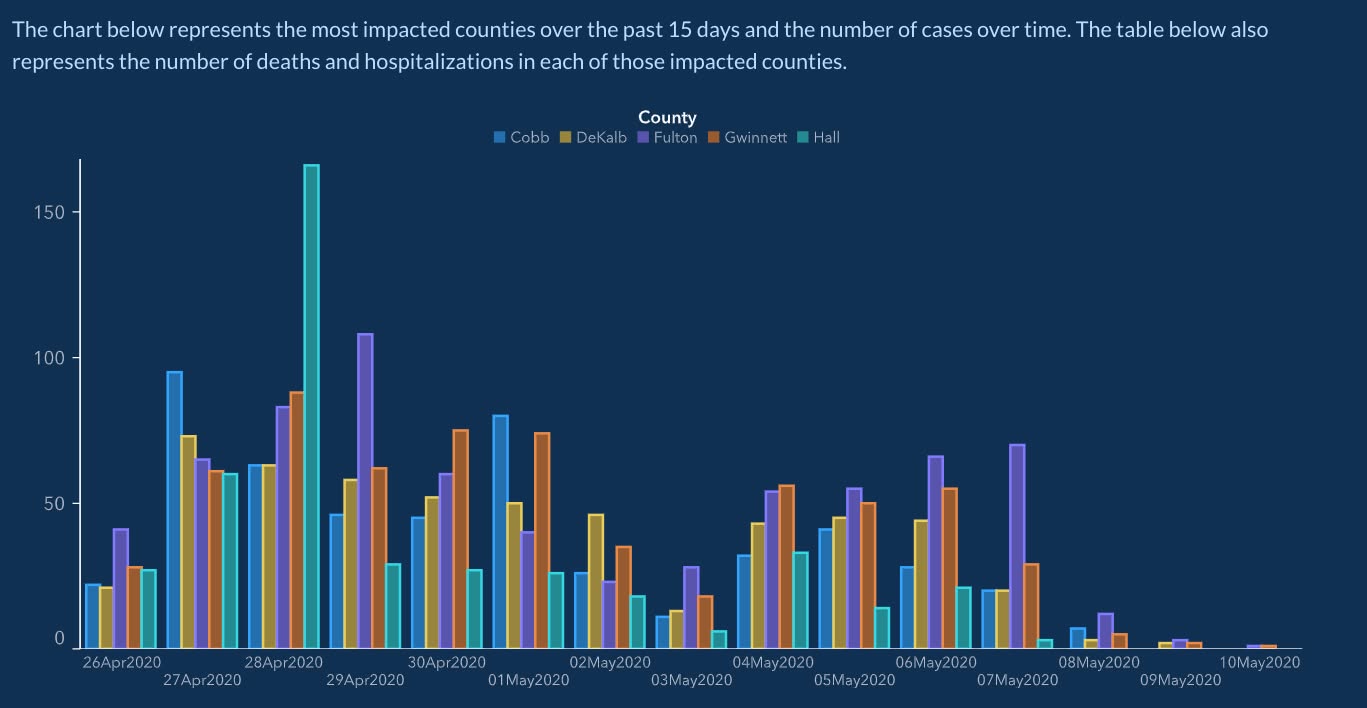
The corrected chart. Credit: Georgia Department of Public Health.
Florida gun deaths (Reuters, 2014). Christine Chan’s chart showed Florida gun deaths after the state’s 2005 “stand your ground” law. Deaths rose from 521 in 2005 to 740 in 2006 and 825 in 2007, but the y-axis was inverted, so the rise looked like a decline. Professor Lisa Wade objected: “But that’s not what the graph shows.” Chan replied: “I prefer to show deaths in negative terms (inverted).” She described the inversion as a matter of preference; critics said it made a rise look like a decline.
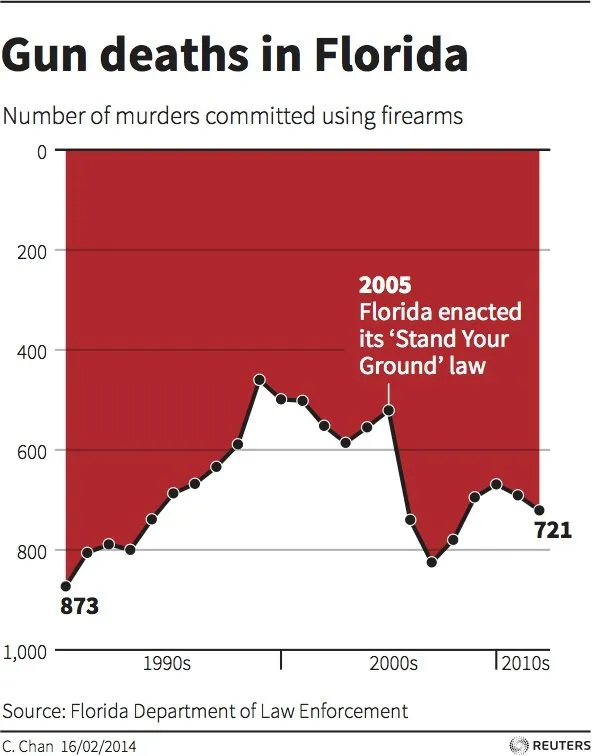
Florida gun deaths with an inverted y-axis. Credit: Reuters, via Live Science.
The Challenger launch (1986). Edward Tufte argued that the engineers who opposed the launch failed to communicate their concern with their last-minute charts, and he offered a temperature-versus-damage chart as the clear alternative. Robison, Boisjoly, Hoecker, and Young (2002) answer that Tufte’s chart “does not show the actual O-ring temperature, but a mix of O-ring and environmental temperature,” as Robert Kosara summarizes their argument, and that management pressure, not the charts, shaped the decision. The case is still debated. It shows that a chart’s design can matter in a high-stakes decision, and that even a celebrated chart can be criticized for what it shows.
The Rogers Commission, which investigated the accident, published two plots of the same flight data. The top plot shows only the flights that had O-ring incidents, and incidents appear at both cool and warm temperatures, so temperature looks unimportant. The bottom plot adds the flights with no incidents, and those cluster at the warmer temperatures. Leaving out the flights where nothing went wrong hid the pattern.

Top: flights with O-ring incidents only (Figure 6). Bottom: all flights, with and without incidents (Figure 7). Source: Report of the Presidential Commission on the Space Shuttle Challenger Accident, Vol. 1, p. 146 (NASA).
Readers often cannot tell a mistake from a deliberate choice, and a distorted chart can mislead either way. This is why Last’s fifth rule for visuals is “Avoid distorting the data or image,” and it leads to the next section.
Presenting Data Ethically
A misleading graphic can mislead as effectively as a misleading sentence.
Howdy or Hello? says that ethical graphics are about “not misleading readers and … ensuring access for as many readers as possible.” These are the common ways visuals fall short, each traced to its source.
| Problem | What Happens | The Fix |
| Truncated axis | A bar chart’s axis starts at 9,100 instead of zero, so a small change looks large. | Start bar chart axes at zero. |
| 3D pie chart | Tilting the pie distorts the apparent size of slices. | Use flat, 2D charts. |
| Suppressed context | A widely reported dehydration study used 12 people and was funded by a beverage company’s think tank. | State the source and sample size. |
| Raw counts when rates matter | UFO sightings rose from 1993 to 2013, but so did the population. | Normalize: per capita, per 1,000, per shift. |
| Correlation sold as cause | UFO sightings track internet adoption almost perfectly (r = 0.9959). | Say “tracks with,” not “causes.” |
| Combined groups hiding the story | Titanic crew look least likely to survive, but only 23 were women (87% survived) against 862 men (22%). | Check subgroups and group sizes before reporting a total. |
| Uncited data or images | The reader may not be able to verify the source. | Cite the source in the caption. |
Accessibility is part of the same responsibility.
- Color-blind readers. Avoid red-green and yellow-blue pairs (Howdy or Hello?).
- Screen-reader users. Provide alternative text for graphics (Howdy or Hello?).
Conclusion
Data storytelling starts with deciding the conclusion, then building the visual and the text around it.
Choose the chart that makes the reader compare the right thing, title the takeaway, call out the key number, split crowded charts, and use color to point. Keep it honest and accessible. The same data can tell very different stories, so the writer is responsible for the one the reader sees.
Sources & Further Reading
Everything referenced above, if you want to go to the originals.
- “Data Visualization vs. Data Storytelling” (video) — embedded at the top of this page. Source of the Titanic, McKinsey, UFO, and radial-chart examples.
- Shao, Martinez-Maldonado, Echeverria, Yan, and Gašević, “Data Storytelling in Data Visualisation,” CHI 2024 (doi) — definition of data storytelling and an empirical test of titles, annotations, and color emphasis.
- Segel and Heer, “Narrative Visualization: Telling Stories with Data,” IEEE TVCG, 2010.
- Cole Nussbaumer Knaflic, Storytelling with Data (Wiley, 2015) — exploratory vs. explanatory communication.
- Edward R. Tufte, The Visual Display of Quantitative Information, 2nd ed. (Graphics Press, 2001) — the data-ink ratio.
- Borland and Taylor, “Rainbow Color Map (Still) Considered Harmful,” IEEE Computer Graphics and Applications, 2007.
- Darrell Huff, How to Lie with Statistics (Norton, 1954) — pictograms and other chart tricks, cited via Wikipedia, “Misleading graph.”
- Robert Kosara, “Tufte and the truth about the Challenger,” eagereyes, 2011, summarizing Robison, Boisjoly, Hoecker, and Young, Science and Engineering Ethics 8(1), 2002.
- Marc Lallanilla, “Misleading Gun-Death Chart Draws Fire,” Live Science, April 23, 2014.
- “Georgia apologizes over ‘processing error’ after accusations of manipulating COVID-19 case counts,” FOX 5 Atlanta, May 2020.
- Report of the Presidential Commission on the Space Shuttle Challenger Accident (Rogers Commission), Vol. 1, p. 146 — Figures 6 and 7, O-ring incidents by temperature.
- Suzan Last, “3.4 Figures and Tables,” Technical Writing Essentials (BCcampus) — visuals augment, not replace; the rule to avoid distorting data.
- Last, McMurrey, et al., “Integrating Visuals,” Howdy or Hello? Technical and Professional Communication — not repeating what a graphic shows; alternative text.
- Howdy or Hello?, “Typical Ethics Issues in Technical Writing” — truncated axes, 3D pies, suppressed context.
- Howdy or Hello?, “Tables” and “Figures” — revising text into tables, color-blind accessibility.
- MacMillan and Ozek, “Chapter 4: Visuals,” The Practical Guide to Technical Writing for Engineers and Computer Scientists (Concordia University) — matching visuals to purpose, pie chart limits, crowded labels, grayscale readability.
- Open Technical Communication, 2nd ed., “Chapter 20: Tables and Graphics” (OpenALG), derived from McMurrey and Powell — tables for precise numbers, charts for impact.
- “Chapter 4: Using Graphics and Visuals Effectively” (Ohio State University) — chart-type selection, crowded graphics, grayscale readability.
- Harrisburg Area Community College, “12: Visuals in Technical Documents,” Technical Writing: An Open Educational Resource — interpretive captions, one color per meaning.
- Atkinson and Corbitt, “Integrating Graphic Elements,” Mindful Technical Writing — illustrations supplement text.