|
Video | Choosing a Chart | Principles | Survey of Chart Types | Building Charts | Checklist | Sources |
In “Every Chart Type Ranked: What to Use and What to Avoid,” a data visualization instructor works through the common chart types and sorts the ones that communicate clearly from the ones that mostly decorate.
Choosing the Right Chart
A chart type is a tool for a job, and most jobs can be done by more than one tool.
Technical writing textbooks tend to sort visuals by the job they do. Concordia’s open text matches tables to precise values, bar graphs to category comparisons, line graphs to trends over an ordered sequence, stacked bars and pie charts to parts of a whole, and diagrams to mechanisms. Ohio State’s text pairs scatter plots with two numerical variables and bar graphs with a category and a number. Open Technical Communication says tables suit precise numbers, while charts sacrifice precision for impact.
| The Reader’s Question | Charts Often Used |
| “What’s the exact number?” | Table |
| “Which is bigger?” | Bar or column chart; sometimes a dot plot |
| “Is it going up or down?” | Line chart; sometimes columns or an area chart |
| “What share of the whole?” | Pie or donut chart; sometimes a stacked bar, waffle chart, or treemap |
| “How do these two things relate?” | Scatter plot |
| “How do the parts add up to the total?” | Waterfall chart |
| “Where is the value high or low?” | Heatmap |
Notice the overlap. A share of a whole can be shown with a pie, a stacked bar, a waffle chart, or a treemap. A trend can be a line or a set of columns, depending on whether you want the reader to see the shape or the individual periods. A heatmap, a bar chart, and a table can all answer the same question. The pairings above are starting points, not rules. The right choice depends on the message, the audience, and how much data there is.
Principles That Apply to Most Charts
A handful of habits improve almost every chart, whatever its type.
| Principle | Best Practice |
| Order logically | Sort rankings from largest to smallest. Put time on the horizontal axis, moving left to right. |
| Label directly | Identify the data where it sits: values at the ends of bars, series names beside lines. Readers should not need a legend to know what they are looking at. |
| Remove clutter | Gridlines, borders, and decoration usually carry no information. Cut them. |
| Keep color simple | Use one color for similar items. Spend a second color only on the part you want noticed, and mute the rest. |
| Annotate the context | Mark the event, time period, or key number that explains the data, such as a shaded band or a note at the point where something changed. |
| Limit the categories | Keep the number of slices, lines, and stacked layers low enough to read at a glance. |
| Add dimensions carefully | Size, color, and shape can carry extra variables, but each one can complicate the message. |
A Survey of Chart Types
Dozens of chart types exist. These are the ones worth recognizing, with a rating for how likely you are to use each at work.
Each chart gets one of four labels, based on two questions: is it useful (how likely you are to use it at work), and is it visually interesting?
| All-Star | Workhorse | Show-off | Forgettable |
| Useful and visually interesting | Useful, but plain-looking. You can almost never go wrong with these. | Visually interesting, but rarely useful | Neither. Avoid these at all costs. |
|
|
|
|
|
|
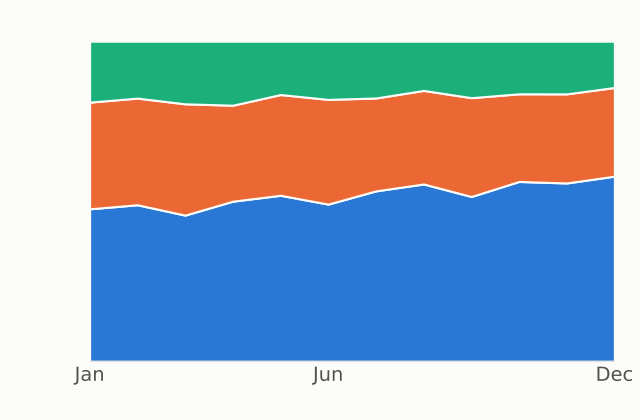
100% Stacked Area Chart
|
Show-off Primary role: Change over time Summary: A 100% stacked area chart focuses entirely on how the makeup of the categories changes over time, which makes it useful for emphasizing metrics such as share. Use few categories, and make the message clear. |
|
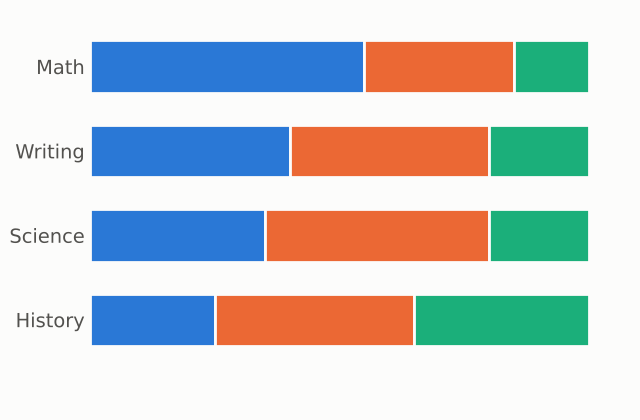
100% Stacked Bar / Column
|
Workhorse Primary role: Compare categories Summary: A 100% stacked chart shows the breakdown for each bar as a percentage, so you can clearly see the makeup of each question or period and even rank them. You can think of it as a set of pie charts stacked next to each other. It is also useful for showing how the makeup of a group changes over time. |
|
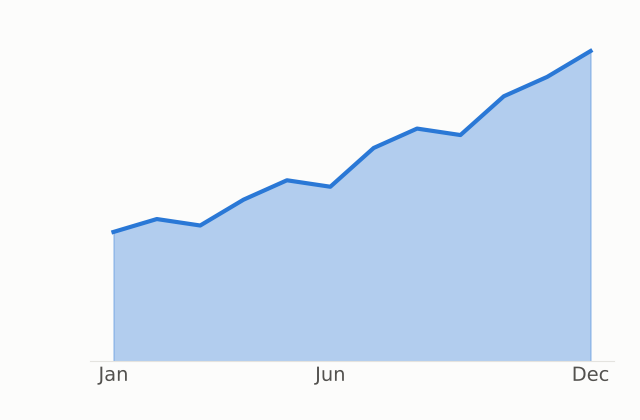
Area Chart
|
Workhorse Primary role: Change over time Summary: An area chart is something like a line chart and a column chart combined. It shows the overall trend while still emphasizing the volume. Avoid using too many categories, and make sure the message is crystal clear. Area charts can look more interesting than lines or columns, but they are easy to misuse. If you only need the trend, a line chart is simpler. Google Sheets also offers a stepped area chart for values that hold steady and then change at set points, such as a rate or a price. |
|
Bar / Column Charts
|
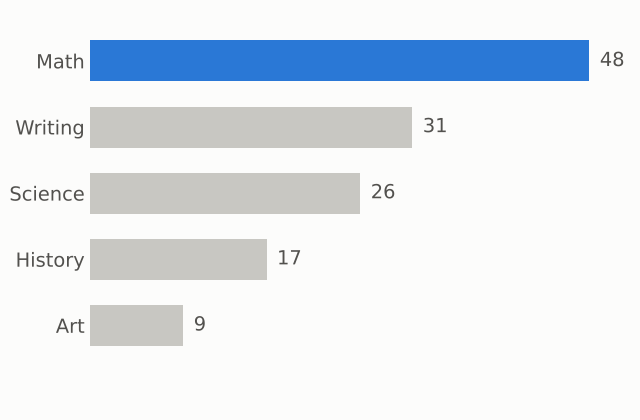
Workhorse Primary role: Compare categories Summary: Bar (horizontal) and column (vertical) charts compare categories by the length of their bars. Readers can compare lengths without worrying about any other dimension, so these suit rankings: even when the bars are close, it is clear which is longer. Order the categories logically, and sort rankings from largest to smallest. Use columns for change over time, because we read time from left to right. Put labels at the ends of the bars, remove the gridlines, and use one color unless you are trying to focus attention. They are the safest default for comparing categories. Use horizontal bars when the category labels are long, since they leave room for the text. |
|
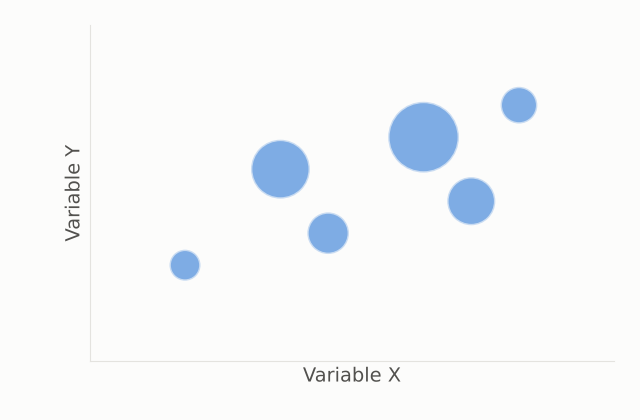
Bubble Chart
|
Show-off Primary role: Relationships and distributions Summary: A bubble chart is a scatter plot whose dot size carries a third variable. It needs much more care than a scatter plot, because the extra dimension can easily complicate the message. |
|
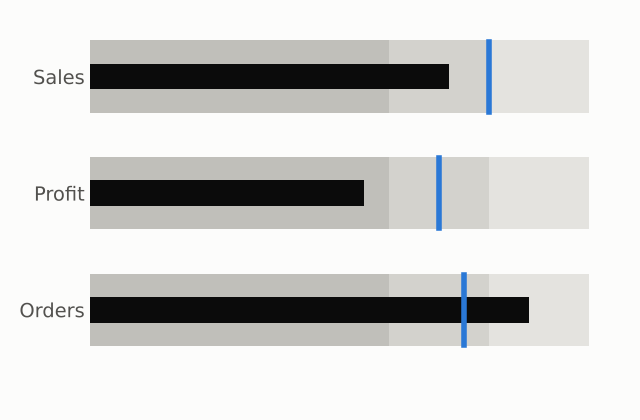
Bullet Chart
|
Forgettable Primary role: Compare categories Summary: A bullet chart shows progress toward a goal. It is plain and not that useful. |
|
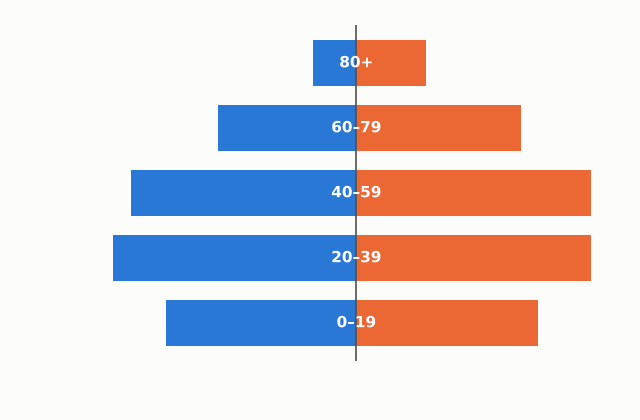
Butterfly Chart (Population Pyramid)
|
All-Star Primary role: Compare categories Summary: A butterfly chart uses the same idea as a diverging bar chart, but the data is often symmetrical. Instead of comparing individual bars, the reader looks at the overall shape. |
|
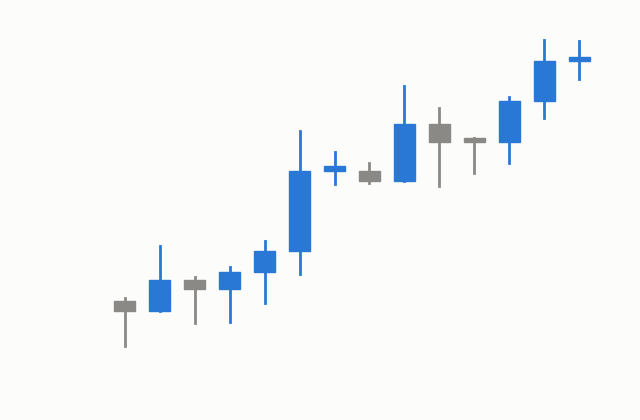
Candlestick Chart
|
All-Star Primary role: Change over time Summary: A candlestick chart shows how a stock’s price moves during a period. The thick body shows the opening and closing prices, and the thin lines (wicks) show the highest and lowest prices. Color shows the direction of the move. |
|
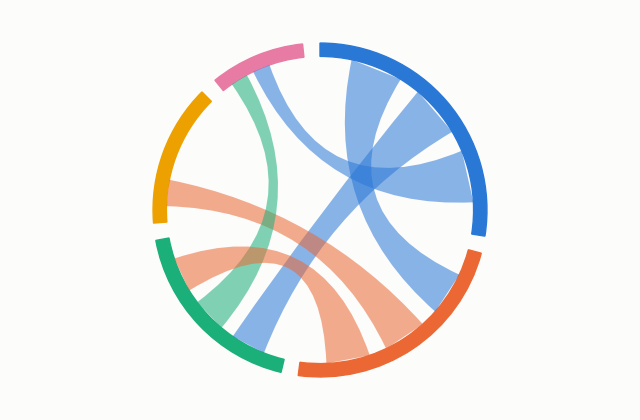
Chord Diagram
|
Show-off Primary role: Flows and connections Summary: A chord diagram shows relationships between different things. The visualization is usually too complicated and hard to understand. |
|
Clustered Bar / Column
|
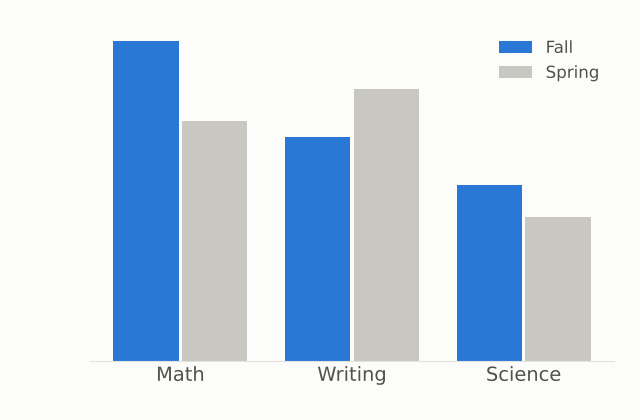
Workhorse Primary role: Compare categories Summary: A clustered chart groups bars by category so the subcategories can be compared side by side. It works like a normal bar chart, except the comparison is between subcategories within each group, such as several question types across regions. |
|
Combination Chart
|
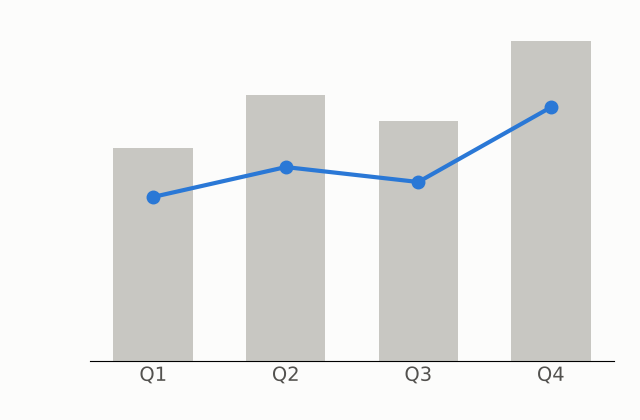
Workhorse Primary role: Change over time Summary: A combination chart puts a line and columns in the same space. It is good for two types of data that are relevant to each other, such as counts and a rate. Make sure everything is clear and that the relationship is not too complicated. |
|
Diverging Bar Chart
|
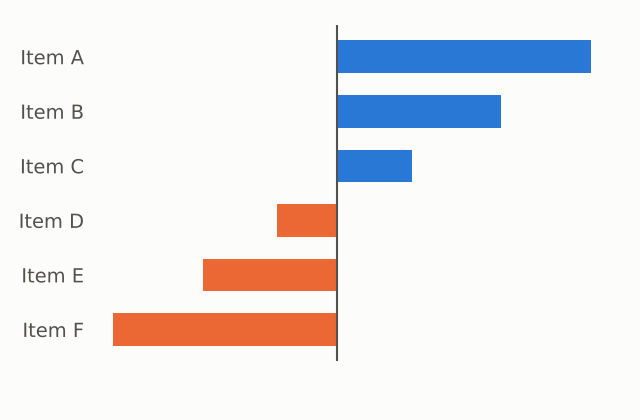
Show-off Primary role: Compare categories Summary: A diverging bar chart shows values for two separate variables extending out from a middle line. It is good for exploring the relationship between two variables across categories. |
|
Donut Chart
|
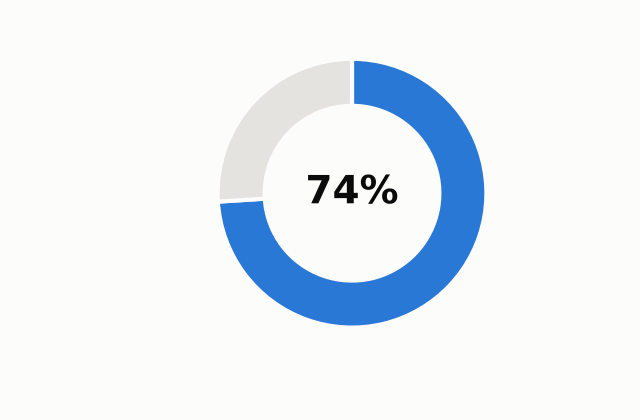
Forgettable Primary role: Parts of a whole Summary: A donut chart is basically a pie chart without the center. It is mostly interchangeable with a pie chart, and the center can hold a title or a number. Because three-quarters or half of a circle is easy to recognize, a donut works well for a single headline share, such as 74%. |
|
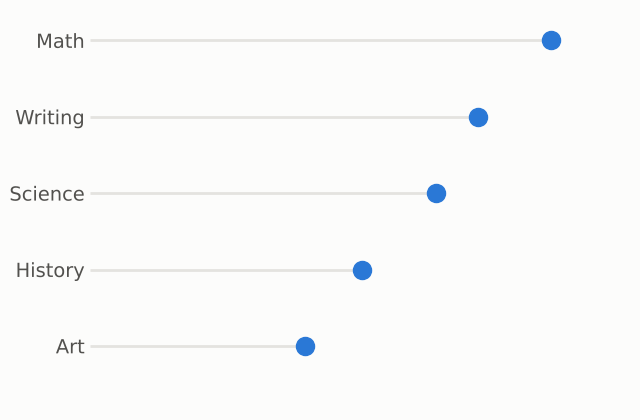
Dot Plot
|
Forgettable Primary role: Compare categories Summary: A dot plot is like a scatter plot with discrete categories. It focuses on one dimension, so it is easy to understand. |
|
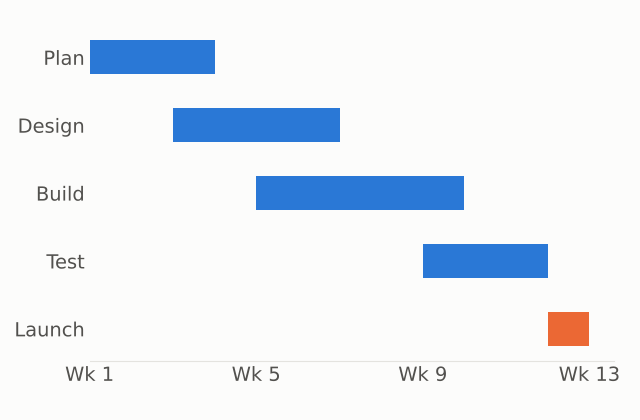
Gantt Chart
|
Workhorse Primary role: Change over time Summary: A Gantt chart shows project timelines and milestones. It is plain but common and can be very useful. |
|
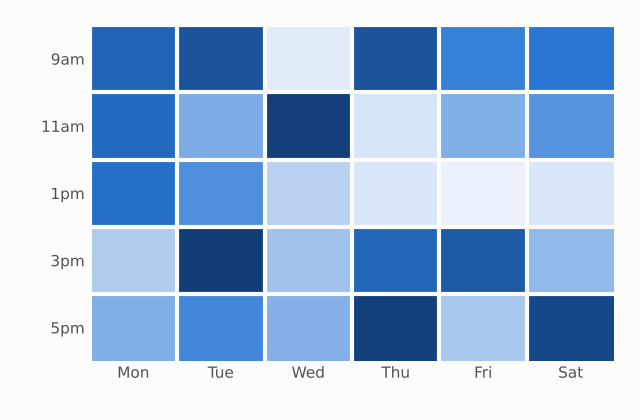
Heatmap
|
All-Star Primary role: Relationships and distributions Summary: A heatmap measures data intensity. Think of a regular table that uses color to show high and low values. It is intuitive and gives a good visual overview, such as retail sales by category or AI adoption by industry and function. Label clearly what the colors mean, and avoid overloading the viewer with variables. If you are communicating a specific message, a bar chart, a line chart, or even a table can sometimes carry it more clearly. |
|
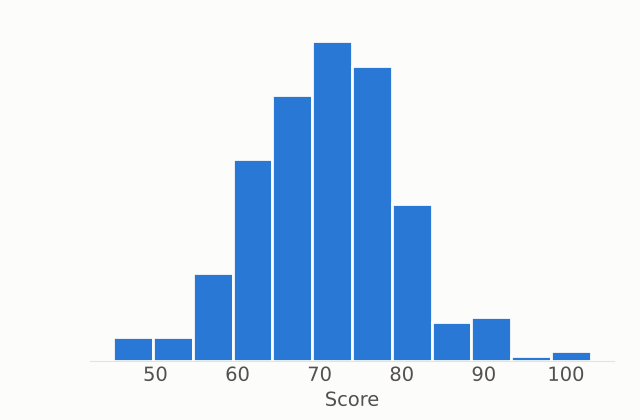
Histogram
|
Forgettable Primary role: Relationships and distributions Summary: A histogram shows a frequency distribution. It looks like a column chart, but each column counts the number of occurrences within a range of values. |
|
Line Chart
|
Workhorse Primary role: Change over time Summary: A line chart puts an emphasis on change over time. A column chart focuses on each individual period; a line connects the data together, so it shows overall trends, patterns, and exceptions. It is also good for comparing the patterns of several categories, such as how spending differs between age groups. Label the lines directly instead of using a legend, and call out important sections, such as a time period or event that is relevant to the data. Excel also offers lines with markers, which suit a few data points where each reading matters, and stacked lines, which show running totals that readers often misread as actual values. Google Sheets offers a smooth line, which implies values between readings that were never measured. |
|
Mekko (Marimekko) Chart
|
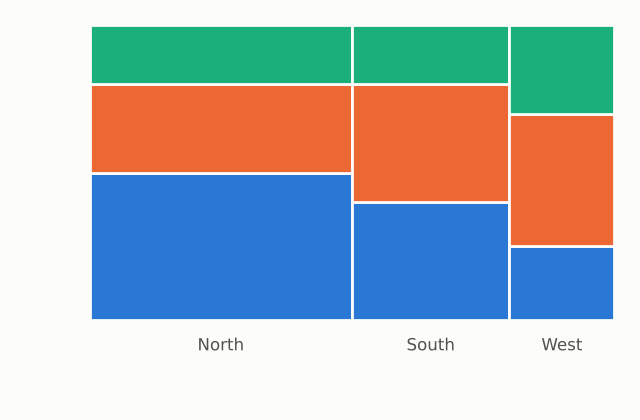
All-Star Primary role: Parts of a whole Summary: A Mekko chart is like a 100% stacked column chart with an additional dimension: the widths of the columns also carry data. It can answer several questions in a single chart, such as who the biggest investors are and where each one puts its money, because every subcategory is visually proportional. Label what the axes mean, and use colors and outlines that make the subcategories distinct. It can confuse audiences, so it is not always useful. |
|
Pareto Chart
|
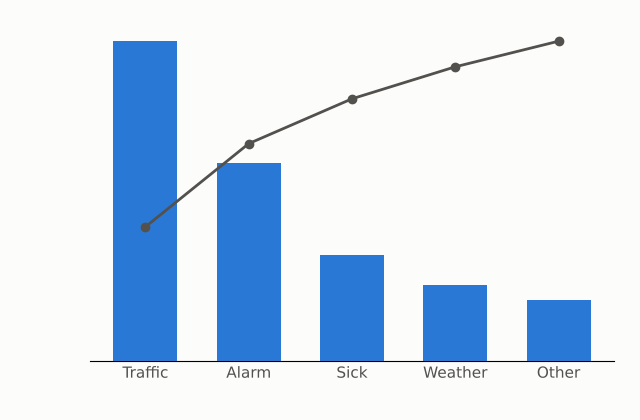
All-Star Primary role: Compare categories Summary: A Pareto chart is a bar chart that also shows how much each bar contributes to the total. The bars show counts, such as the number of people giving each reason for being late to work, and a line shows the cumulative percentage. It offers some of the benefits of a bar chart and a pie chart at once. |
|
Pie Chart
|
Workhorse Primary role: Parts of a whole Summary: Pie charts get a lot of criticism, but used correctly they can be very useful. A pie shows the portion that one category makes up of the total. Avoid using it to compare the categories directly against each other; a bar or column chart does that better. Avoid comparing several pie charts against each other too. Keep the number of categories small and the colors minimal, and emphasize the category you are focusing on while muting the others. The eye cannot compare slice sizes as precisely as bar lengths, which is why bars win when the reader must compare. |
|
Radar (Spider) Chart
|
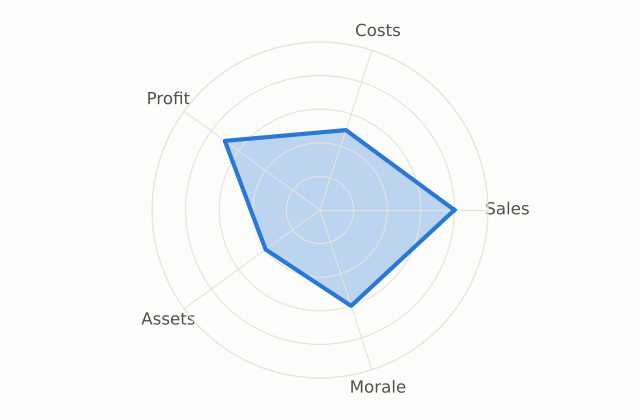
Show-off Primary role: Relationships and distributions Summary: A radar chart plots data points on a set of axes that radiate from a central point, then connects the points. It can be useful when the message is obvious, but it has challenges. The order of the categories changes the shape of the web, and the categories are weighted equally even when they should not be compared with each other (sales, costs, profit, assets, and satisfaction, for example). A clustered column chart or a line chart often works better. |
|
Range Bar Chart (Football Field)
|
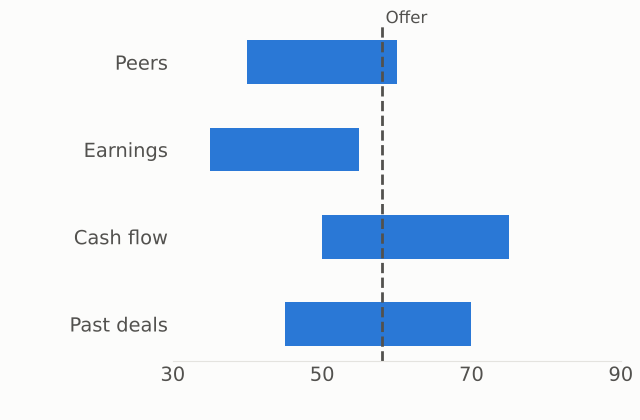
Show-off Primary role: Compare categories Summary: In a range bar chart, the bars do not all start in the same place. Instead of comparing absolute values, you compare ranges. It is common in finance, where it shows the different valuations of a company from different methods. Some call it a football field chart. |
|
Ribbon Chart
|
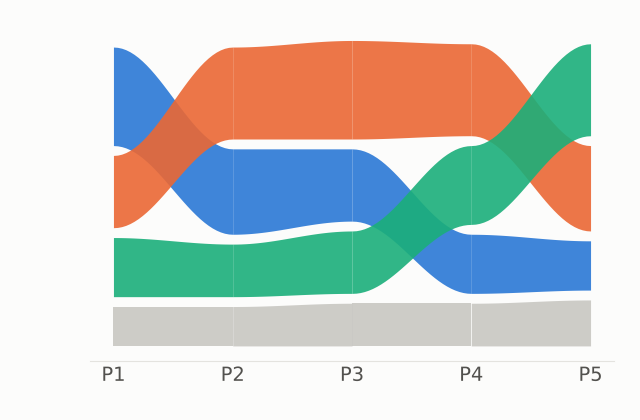
Show-off Primary role: Change over time Summary: A ribbon chart is like a stacked column chart, but the categories are ranked within each column, so you can see a category move up and down in rank over time. It is easy to misuse, because many categories make it complicated and it does not always depict the data accurately. A stacked bar chart or a line chart is usually better. |
|
Sankey Diagram
|
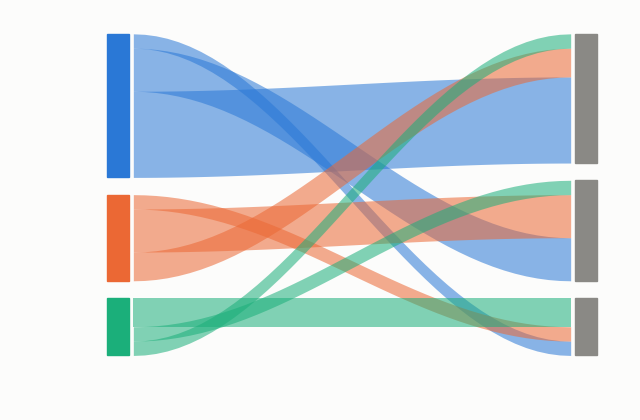
Show-off Primary role: Flows and connections Summary: A Sankey diagram shows the flow of things, such as the breakdown of a company’s revenue. It is interesting to look at, but rarely appears in real presentations. |
|
Scatter Plot
|
All-Star Primary role: Relationships and distributions Summary: A scatter plot is a collection of dots, each plotted at an x and y coordinate. It shows the relationship between two variables, such as inventory turnover and profit margin. The relationship can be positive, negative, or absent. It can also show where one point sits among the others, such as one model of truck among its competitors. You can add variables by changing the size of the dots, the color, or the shape, but each addition can complicate the message. The simplest version is usually best. Both variables must be numbers. The scale of each axis affects how strong the relationship looks. |
|
Stacked Area Chart
|
All-Star Primary role: Change over time Summary: A stacked area chart shows the overall trend and how each category contributes to the total. The focus is still on the overall trend, but unlike a line chart, the categories stack on top of each other, so it is easy to see each one’s contribution. Use few categories. Only the bottom layer sits on a common baseline, so readers can misjudge the size of the upper layers. |
|
Stacked Bar / Column
|
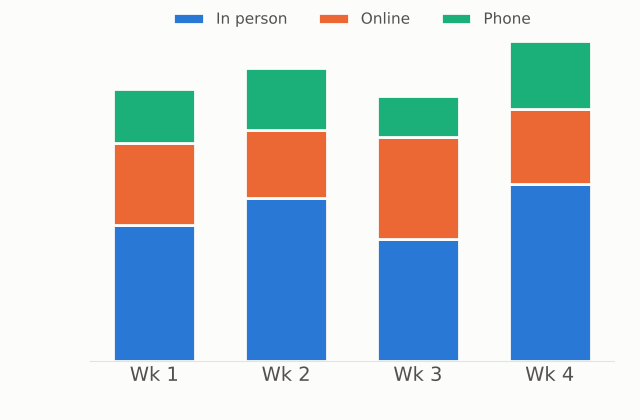
Workhorse Primary role: Compare categories Summary: A stacked chart shows the total of each bar and also its breakdown. Be careful not to tell a story about the breakdown. The total is what is easiest to see. |
|
Sunburst Chart
|
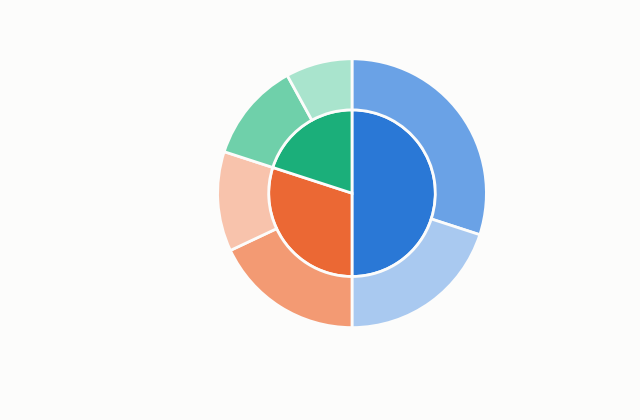
Show-off Primary role: Parts of a whole Summary: A sunburst chart is like a pie chart with multiple layers of category breakdowns. It is interesting but not always intuitive, and a treemap does much the same thing without the circle. |
|
Treemap
|
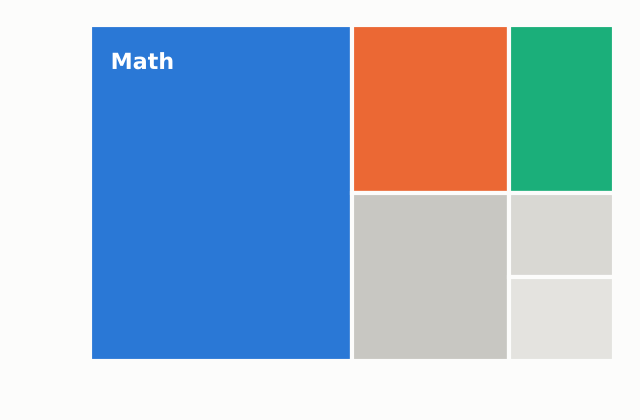
Show-off Primary role: Parts of a whole Summary: A treemap shows the proportion that each category makes up of the total, like a Mekko chart, but it can nest categories and does not follow the same rigid dimensions. It is good for showing how one category fits within a larger group. Use color to separate groupings, or use size for one measure and color for another, as in a stock-market treemap where size shows trading volume and color shows change in value. Make sure the message is obvious. If you are comparing categories directly, a bar chart is better. |
|
Waffle Chart
|
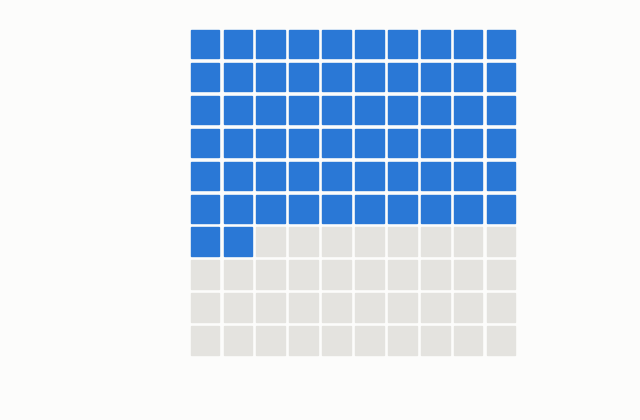
Forgettable Primary role: Parts of a whole Summary: A waffle chart works like a pie chart, drawn as a grid of squares. It can be more fun to look at and sometimes easier to compare, something like a stacked column chart mixed with a pie chart. |
|
Waterfall Chart
|
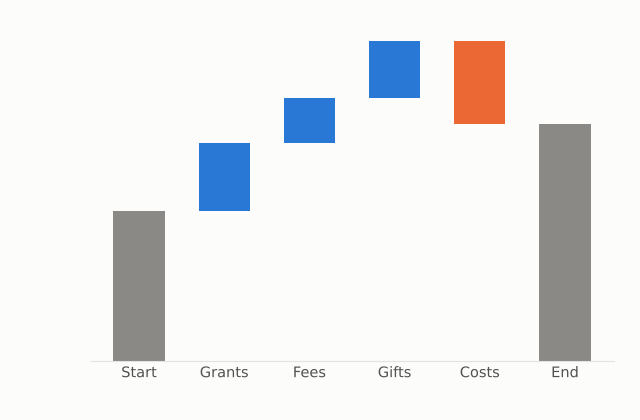
All-Star Primary role: Parts of a whole Summary: A waterfall chart is like a column chart whose pieces are separated into smaller floating values, so you can see how individual pieces build up to a total, such as the sources of capital for a project. Label the floating columns, add groupings or totals where possible, and be careful with color. |
Building Charts in MS Excel or Google Sheets
Microsoft Excel and Google Sheets are the two most common places workplace charts get built.
Most offices run on one or the other, and both handle every chart below. Other tools are worth knowing, especially when you need a cleaner design or an interactive chart:
- Datawrapper: free, quick, clean charts and maps, built for journalists.
- Flourish: interactive and animated charts.
- Canva: simple charts inside designed documents and graphics.
- Tableau Public: dashboards and data exploration.
The steps below are for Google Sheets in a web browser and Excel for Microsoft 365 on Windows. Menus on a Mac or in older versions may differ slightly. In the steps, Insert > Chart means open the Insert menu (or ribbon tab), then choose Chart.
Column / Bar Charts , Line Charts , Area Charts , Pie / Doughnut Charts , Scatter Plots
 |
Column / Bar ChartsRectangles whose length shows a value. Columns run up and down; bars run side to side. |
|
GOOGLE SHEETS
|
MICROSOFT EXCEL
|
||||||||||||||||||||||||||||
|
PRO TIPS
|
|||||||||||||||||||||||||||||
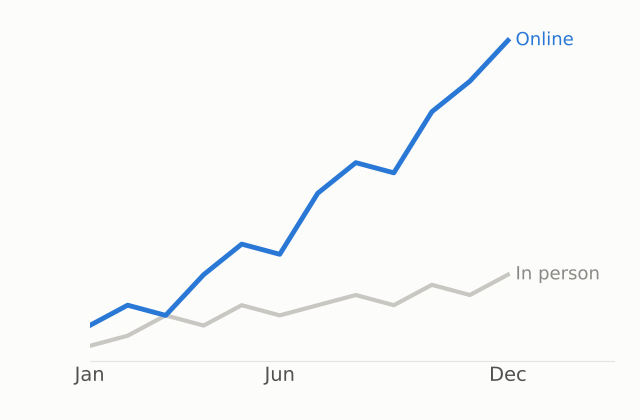 |
Line ChartsPoints connected by a line, usually with time running along the bottom. |
|
GOOGLE SHEETS
|
MICROSOFT EXCEL
|
||||||||||||||||||||||||
|
PRO TIPS
|
|||||||||||||||||||||||||
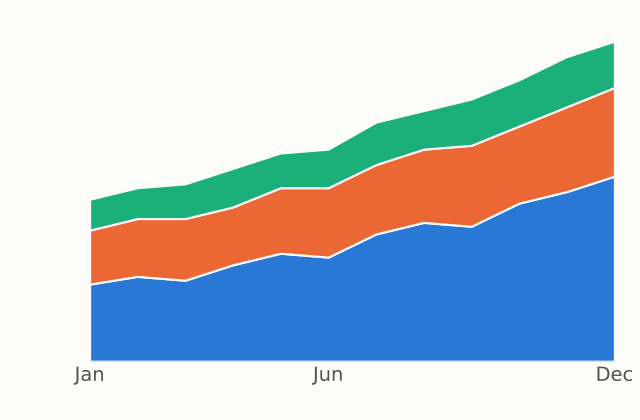 |
Area ChartsA line chart with the space beneath the line filled in. Stacked versions pile categories on top of each other. |
|
GOOGLE SHEETS
|
MICROSOFT EXCEL
|
||||||||||||||||||||
|
PRO TIPS
|
|||||||||||||||||||||
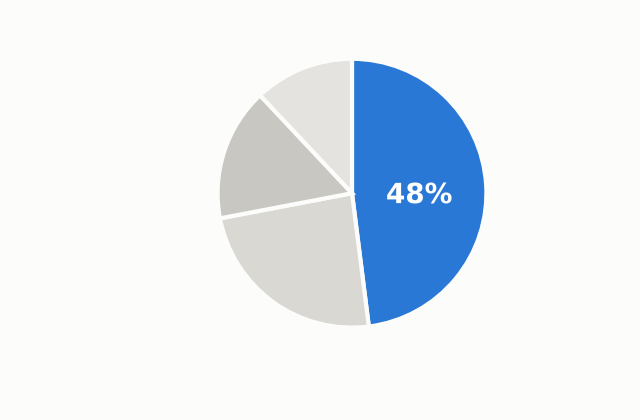 |
Pie / Doughnut ChartsA circle divided into slices that add up to 100%. A doughnut is a pie with the center cut out. |
|
GOOGLE SHEETS
|
MICROSOFT EXCEL
|
||||||||||||||||||||||||
|
PRO TIPS
|
|||||||||||||||||||||||||
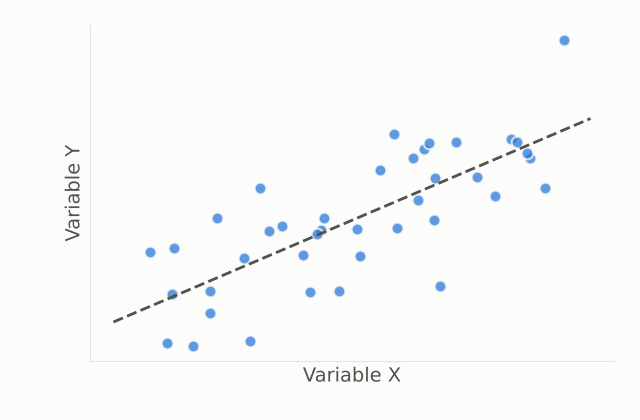 |
Scatter PlotsDots placed by two numbers: one sets how far across, the other how far up. |
|
GOOGLE SHEETS
|
MICROSOFT EXCEL
|
||||||||||||||||||||
|
PRO TIPS
|
|||||||||||||||||||||
Chart Checklist
Run through this list before you drop a chart into a document.
| Check | Look For |
| ☐ The message | You can state the takeaway in one sentence, and the title says it. |
| ☐ The chart type | The chart makes the reader compare the thing your message is about. Could a simpler chart or a table do the job? |
| ☐ The order | Rankings are sorted. Time runs left to right. Categories are in a logical order. |
| ☐ The labels | Values or labels are placed directly on bars and lines. Axes have titles and units. The legend is gone if direct labels replace it. |
| ☐ The clutter | Gridlines, borders, 3D effects, and anything that carries no information are removed. |
| ☐ The color | One main color, with one highlight. Meanings are consistent. Colors can be told apart in grayscale and by color-blind readers. |
| ☐ The count | Few categories. Pie charts have few slices (Ohio State suggests five or fewer). Area charts and treemaps are not crowded. |
| ☐ The scale | Bar chart axes start at zero. Scales do not exaggerate change. |
| ☐ The callout | The key number, period, or category is marked so the reader does not have to find it. |
| ☐ The focus | The chart carries one message. If it carries several, it is split. |
| ☐ The explanation | Axes, colors, and sizes are explained wherever the reader might wonder what they mean. |
| ☐ The caption and source | The chart has a number, a descriptive caption, and a source if the data is not yours. |
| ☐ The print test | It still works in black and white and at the size it will be printed. |
Sources & Further Reading
Everything referenced above, if you want to go to the originals.
- “Every Chart Type Ranked: What to Use and What to Avoid” (video) — embedded at the top of this page. Source of the chart survey, the four labels, and the principles.
- MacMillan and Ozek, “Chapter 4: Visuals,” The Practical Guide to Technical Writing for Engineers and Computer Scientists (Concordia University) — matching visuals to purpose, pie chart and label guidance.
- “Chapter 4: Using Graphics and Visuals Effectively” (Ohio State University) — chart-type selection, pie chart limits, trend lines.
- Open Technical Communication, 2nd ed., “Chapter 20: Tables and Graphics” (OpenALG) — tables for precise numbers, charts for impact.
- Howdy or Hello? Technical and Professional Communication, “Typical Ethics Issues in Technical Writing” — truncated axes and 3D pie charts.